Analytics Dashboard
Use the Analytics Dashboard to access detailed data and visualizations of user search queries and behaviors on your site. This guide explains common terms and describes the key sections of the dashboard.
Glossary of Terms
- Keyword: Words or phrases users enter in the search box.
- Total Searches: The total number of search queries performed.
- Clicks: The total number of times users click on search results.
- Click Through Rate (CTR): The ratio of clicks to searches, calculated as (Total Clicks) / (Total Searches).
- Average Click Position (ACP): The average rank position of clicked search results, where a lower number means users click higher-ranked results. For example, if one user clicks the 1st result and another clicks the 2nd for the keyword "mask," the ACP is (11 + 12) / 2 = 1.5.
- Page URL: The web address for each search result.
Overview
The Overview section summarizes user search statistics, updated daily:
- Popular keywords and their trends.
- Charts showing searches and clicks.
- Click Through Rates and Average Click Position for keywords.
You can adjust the chart to display data by day, week, or month within a date range of up to 100 days.
Latest Keywords
This table lists the most recent search terms entered by users on your site.
No Hits Keywords
This section shows keywords that returned no search results, including the number of times each was searched within the selected date range.
Keywords Section
In the Keywords section, you see your site’s most searched keywords. Selecting a keyword displays:
- URLs clicked after searching for that keyword.
- Click counts per URL.
- Average Click Position (ACP) per URL.
- The share of total clicks each URL receives.
- A daily analytics graph showing how search volume for the keyword changes over time.
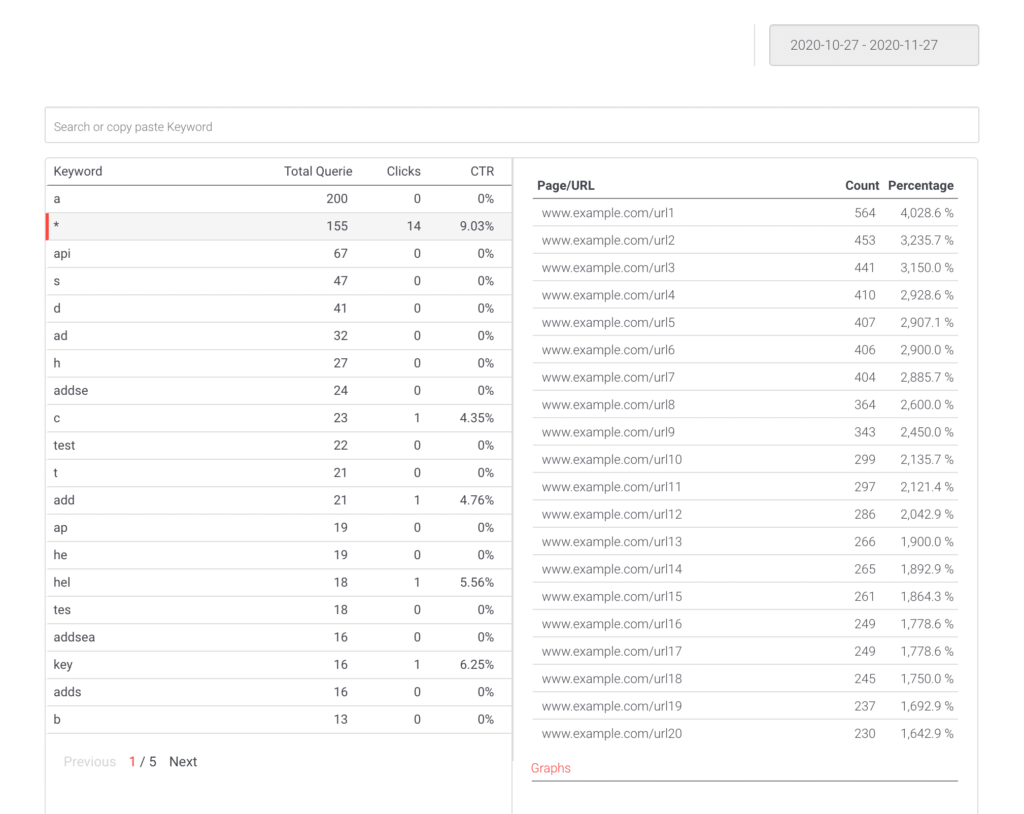
Results Section
This section displays the most clicked page URLs on your site and the keywords that led users there. You can view full URLs alongside their associated keywords.
Exporting Analytics Data
At the bottom of the Overview section, you can export your analytics data as a Microsoft Excel workbook. The export respects the date range currently selected on the dashboard.
Note: Generating the Excel workbook may take a short time depending on data volume.
Use the Analytics Dashboard regularly to understand user search behavior and optimize your site accordingly.